
The final economic accounting for the atmospheric anomaly known as Winter Storm Fern reveals a catastrophic intersection of aging infrastructure and the unyielding baseload requirements of the AI-driven economy. According to preliminary estimates from AccuWeather and Bank of America, “Economic Damage” is currently pegged between $105 billion and $115 billion in total losses. This figure encompasses physical infrastructure repairs and a substantial erosion of first-quarter GDP, estimated to shave between 0.5 and 1.5 percentage points off national growth. The “How Much” is further defined by $23 billion in capacity costs passed to ratepayers and over $1.1 billion in fuel cost overruns for major utilities.
The Lede: The Market Shock and the Short Squeeze
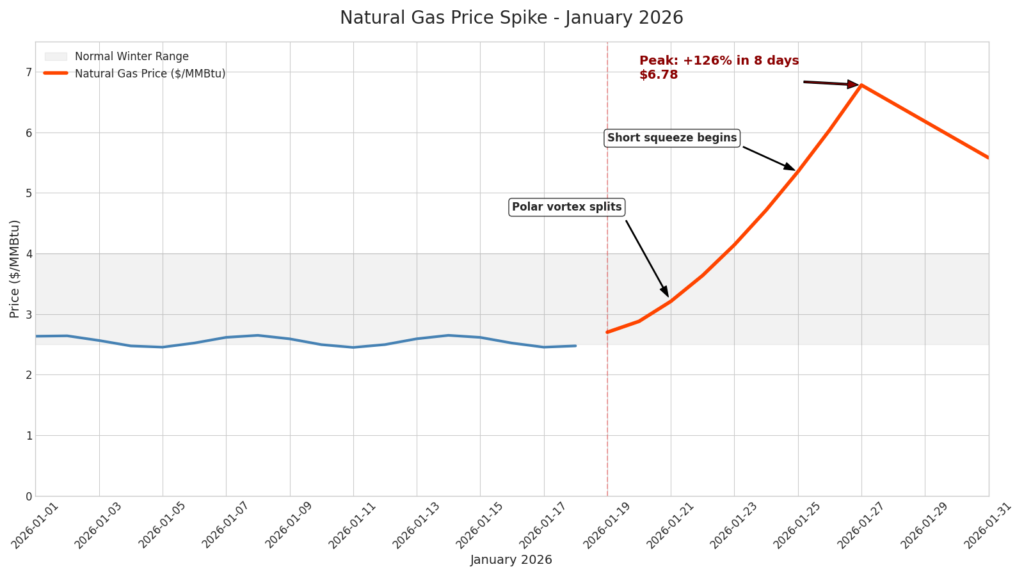
The financial carnage of January 2026 was precipitated by a collective failure of institutional imagination. Energy traders, bolstered by a mild start to the season, entered the winter months with a “bearish” outlook. By mid-January, speculator short positions were at a 14-month high. This complacency was shattered when a Stratospheric Warming event fractured the polar vortex, sending prices into a parabolic ascent.
The resulting Henry Hub Spike was historic. On January 19, natural gas futures languished near $2.70 per million British thermal units (MMBtu); by January 27, they skyrocketed nearly 30% in a single session to settle at $6.78/MMBtu. This was a classic “Short Squeeze,” as traders were forced to cover positions at any price. In physical spot markets, regional hubs in the Northeast reported trades as high as $58/MMBtu as utilities scrambled for fuel.
| Key Market Impact (Jan 2026) | Peak Value | % Change / Comparison |
| Henry Hub Futures | $6.78/MMBtu | +126% from Jan 18 |
| PJM Virginia Spot Power | $1,800/MWh | 9x jump vs pre-storm |
| US Gas Production Loss | 15 Bcf/d | ~15% of total output |
| GDP Growth Impact | -1.5% | Estimated Q1 reduction |
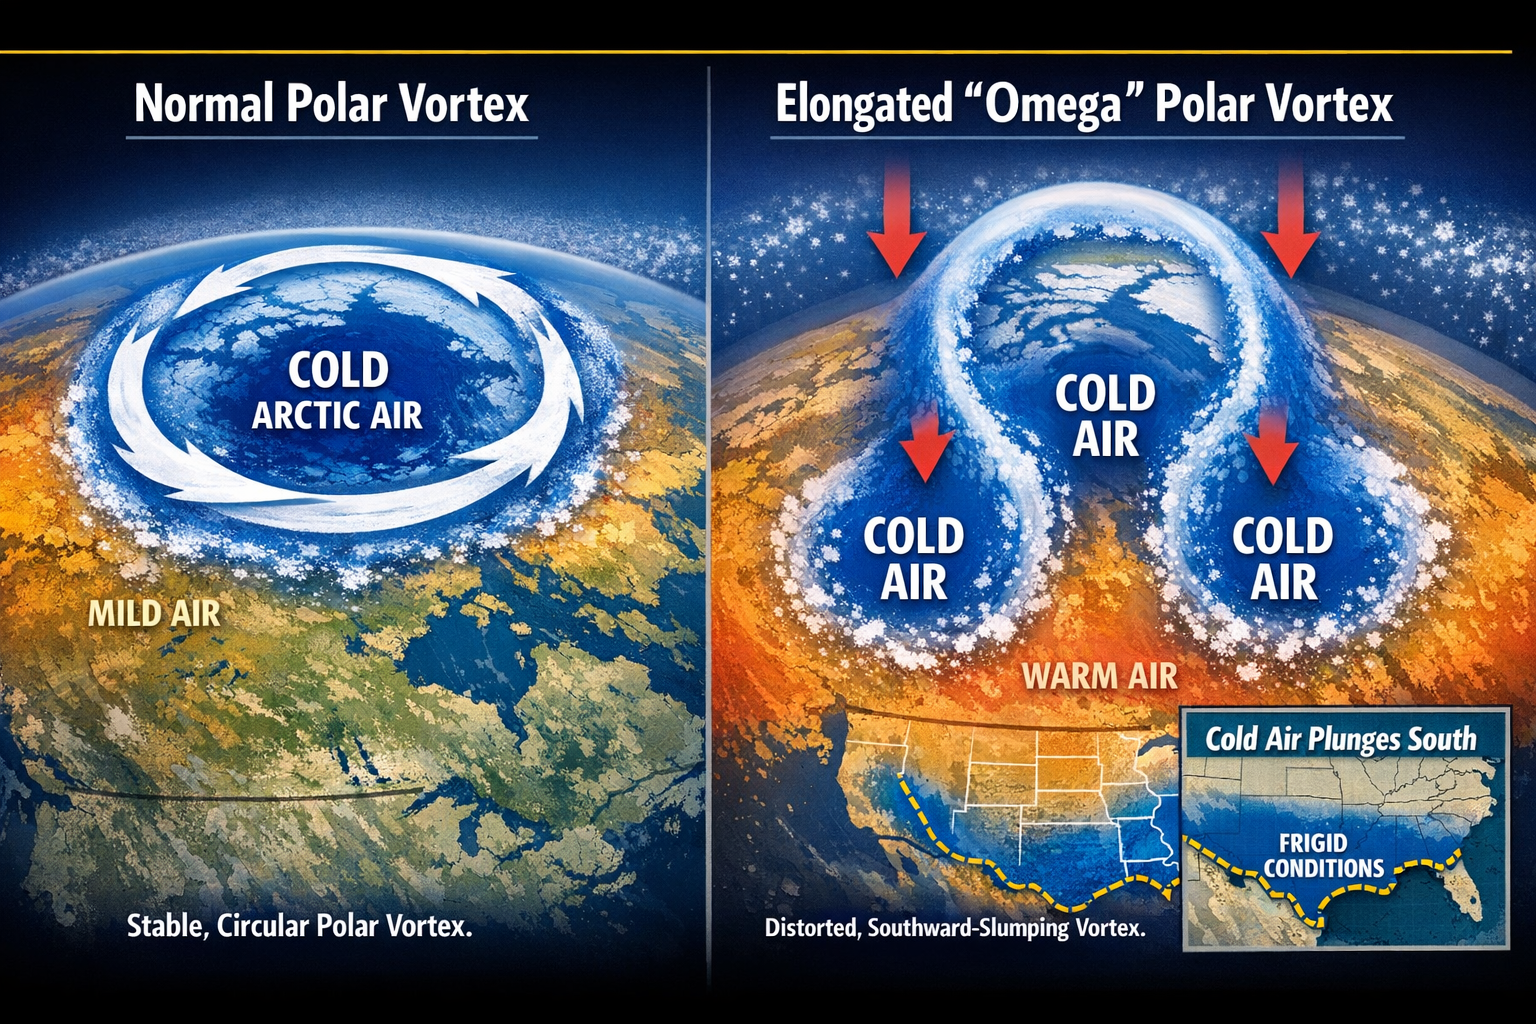
The Science: The Elongated Vortex
The physical mechanism behind Winter Storm Fern originated 20 miles up. A Stratospheric Warming event disrupted the polar night jet, causing the polar vortex to lose its circular integrity. The vortex became elongated, developing “cold legs” that acted as a direct corridor funneling Arctic air deep into the North American interior. This omega-shaped distortion pushed a sub-zero air mass as far south as the Gulf Coast, where 72°F waters fueled intense cyclogenesis and catastrophic ice storms.
The Supply Failure: 15 Bcf/d Offline
As the Arctic front descended, the physical limits of natural gas infrastructure were breached. The primary cause was “Natural Gas Freeze-offs,” where water vapor produced alongside the gas solidified at the wellhead, physically choking supply. The scale was staggering: nearly 15 billion cubic feet per day (Bcf/d) of production—roughly 15% of the nation’s output—was knocked offline within 72 hours. The Permian Basin, designed for average lows of 25°F to 35°F, was paralyzed by temperatures dropping 20 to 30 degrees below seasonal norms. This supply shock trickled into the LNG market, as feedgas flows to terminals like Sabine Pass were sharply curtailed.
The Grid Crisis: “Data Center Alley” and the AI Era
The core of the crisis lay in the PJM Interconnection, serving 67 million people. The grid faced a “Double Whammy”: record residential heating demand colliding with the inflexible power needs of Northern Virginia’s “Data Center Alley”.
The $1,800/MWh Reality
In Virginia, real-time wholesale electricity prices topped $1,800 per megawatt-hour (MWh) early on Sunday, January 25—a nine-fold increase from the previous morning. Unlike traditional industrial loads, AI data centers represent a “hard floor” of demand that cannot be easily curtailed. PJM reported 21 gigawatts (GW) of generation outages—16% of total demand—as gas-fired plants failed to secure fuel. PJM predicted an all-time winter demand record of 147.2 GW, surpassing the previous 2025 high. Data center load growth is now cited as the “primary reason” for these tight supply-demand imbalances.
To prevent a total collapse, the Department of Energy (DOE) issued federal 202(c) emergency orders, authorizing power plants to bypass environmental emissions limits to maximize output. Energy Secretary Chris Wright further directed backup diesel generators at data centers to be pushed onto the public grid as a “last resort”.
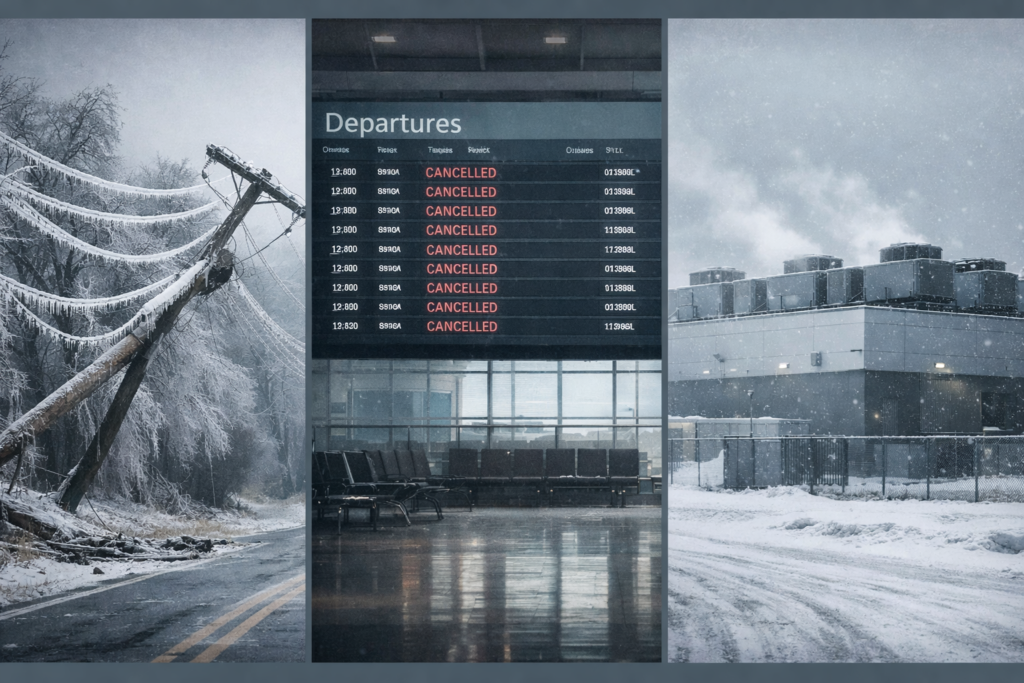
The Human Toll: The Ice Storm of the South
While the North battled snow, the South was paralyzed by a “crippling ice storm”. At least 50 fatalities were confirmed as of January 26. In Tennessee, nearly 339,000 customers were without power as ice accumulations of up to 0.75 inches snapped utility poles. Mississippi Governor Tate Reeves confirmed fatalities due to hypothermia and falling trees, describing infrastructure damage as “extensive”.
Transportation systems faced systemic collapse with over 15,000 flights canceled over the four-day period. Sunday, January 25, marked the largest single-day cancellation event since March 2020, with Reagan National (DCA) canceling 99% of its flights. The chaos extended to digital infrastructure; ice accumulation on GPS antennas degraded satellite signals, while delivery apps like DoorDash suspended operations entirely.
Conclusion: Redefining Resilience
Winter Storm Fern was a “stress test” that exposed the friction between a 20th-century grid and a 21st-century digital economy. The $1,800/MWh price spikes and 15 Bcf/d production failure suggest a system operating at its absolute limit. Long-term resilience will require more than emergency 202(c) waivers; it necessitates the hardening of natural gas infrastructure in the South and a fundamental rethink of how inelastic, massive AI loads are integrated into a thinning grid. Until then, the energy market remains at the mercy of the stratosphere.
READ OUR OTHER ARTICLES
- Iran’s Darkest Day: Screams for Revenge and a Missing Leader
 On Sunday, July 5, 2026, Iran entered the tense and highly charged Khamenei funeral Day 2. This marked a critical moment in a six-day state funeral meant to show the … Read more
 - अजीत कुमार: प्रेरणादायक सफर और वैश्विक उपलब्धियों का महाकाव्य
 भारतीय सिनेमा के परिदृश्य में कुछ ऐसे व्यक्तित्व होते हैं जो पर्दे की चकाचौंध से परे जाकर समाज और संस्कृति पर अपनी अमिट छाप छोड़ते हैं। दक्षिण भारतीय सिनेमा के … Read more
 - Coachella 2026: Highlights and History-Making Moments You Missed!
 The 25th anniversary of the Coachella Valley Music and Arts Festival just wrapped up, and it was absolutely legendary! From April 10–12 and April 17–19, 2026, the Empire Polo Club … Read more
 - वैभव सूर्यवंशी का टीम इंडिया में चयन हो चुका है?
 भारतीय क्रिकेट के इतिहास में कुछ क्षण ऐसे आते हैं जो केवल खेल के आंकड़ों को नहीं बदलते, बल्कि पूरे देश की खेल भावना और भविष्य की दिशा को पुनर्परिभाषित … Read more
 - US-Iran War Alert: Massive Stock Market and Sensex Crash
 If you opened your trading app this Monday and felt a knot in your stomach, you aren’t alone. The Indian stock market is currently going through one of its toughest … Read more